![]()


|
|
|
As a school board member we have numerous responsibilities. One primary responsibility is to oversee the school district's budget and maintain a positive rating from the County Office of Education resulting in sound fiscal health. Whenever the budget does not meet specified criteria, the County Office of Education issues a qualiifed or negative certification of a District Budget. Here is a list of Statewide Negative and Qualified Districts as of March, 2005. The list of troubled school districts has grown to over 175 school in June, 2010.Here is a list of fiscal indicators that need to be monitored. Alameda County Office of Education Financial Recap of School Districts 2005-06 The complexities of a school district's budget are immense. At the highest level, the Board of Education is responsible to insure that the district can operate from year to year without going bankrupt. To monitor this responsibility, the Board of Education reviews and approves financial reports while monitoring a number of other indicators.
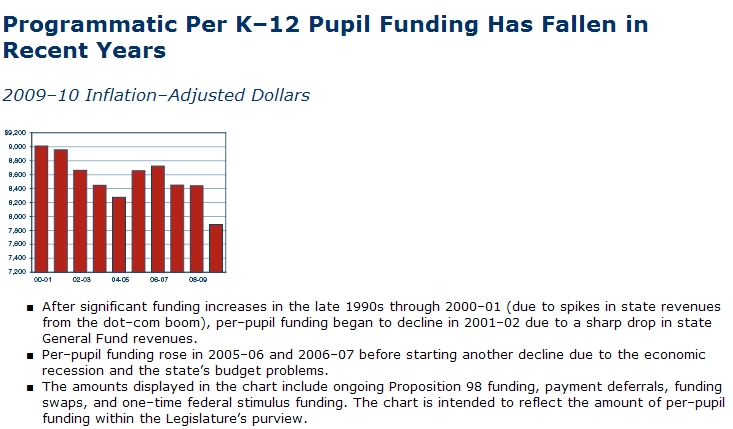
Each year AUSD is required to develop a new budget for the coming year that is based on complicated funding streams. Here is the timeline for a Budget Development Calendar. The Budget Building Blocks is an overview of the budget development process. The major revenue source for any school district is amount of money (base revenue limit per student) each district receives from the State based on average daily attendance (ADA). Here is a revenue limit comparison of how Alameda compares to other school districts in Alameda county. Since taking office in Janaury, 2003, California has been experiencing an annual budget crisis. In fact, after his November, 2002 reelection, Governor Davis initially announced a budget deficit exceeding $20 billion that grew to $34 billion when he submitted his budget in January, 2003. In 2004, Governor Davis was recalled and replaced with Governor Schwarzenegger. Governor Schwarzenegger's bold attempt to reform state fiscal problems in 2005 was defeated at the polls, primarily led by the California Teachers Association. Strong revenue growth from the housing sector made the 2006 budget process relatively easy with this report from the Legislative Analyst Office. By June, 2008, things started to collapse. The perfect storm of housing bubble bursting, a national credit crisis and sagging consumer confidence led to a new budget deficit exceeding $40 billion for the 2009/10 budget cycle. The Legislative Analyst Office prepared a slide showing the per pupil funding for the first decade of the 21st century from 2009-10 State Facts report: EdSource issued their analysis of the 2010/11 budget. The Legislative Analyst Office prepared the 2012-13 State Facts report in January, 2014. In November 2012 California voters approved Prop 30 which increased sales taxes and income taxes and provided new revenues for public education. With revenues stabilized for the time being, the Governor was able proposed and then persuade the Legislature to pass a new funding model for public education called Local Control Funding Formula. In 2014, a national study of school funding was issued in this state by state review.
Beyond the State budget problems, Alameda has been experiencing declining enrollment (2007 Report on Statewide Declining Enrollment). Loss of students has a direct impact on the amount or revenue the District receives. Combined with lowered State funding due to the State budget woes, Alameda has made budget reductions in 2001 ($1.6 million) 2003 ($1.7 million), 2005 ($1.6 million) 2006 ($800,000), 2007 ($1.4 million) and 2008 ($976,000). Only with the passage of Measure A and Measure H has Alameda been able to maintain programs like class size reduction for grades K-3 and maintain small schools.After an unsuccessful attempt to extend and combine Measures A & H, Alameda voters passed a replacement parcel tax that goes through 2018. In 2013, EdSource published a comprehensive review of the parcel taxes. In 2020, the LAO issued a review of the state of school districts finances. Here is a basic primer on public education finances along with CA public education legislative history including the Serrano Decision, parcel taxes and Prop 98. In 2000, the Public Policy Institute of California prepare a 200 page review of public education financing in California. Californians pay slightly more then then national average in state and local taxes with most recent comprehensive data from 2005 showing California above average tax burden. When Prop 98 could be not funded, the Legislature did a Triple Flip of revenues. Here is an updated look at California tax sources published in October, 2007. In 2010 a report was published which showed California tax burden compared to other states and year by year. Over the last 35 years the fiscal relationship between state and local governments has changed and here is a quick reference guide from the LAO. In 2010, California Budget Myths and Prop 13 Commercial Property Tax Impact Study were published. EdSource published an 2010 evaluation of California's investment in education, comparing California with the nation and other similar states. In another 2010 study, their calculations show California 31st overall in education spending. This 2010 study examines how the states fund public education and this 2012 study examines the current inequities in school funding in California. This 2010 study proposes pathways to a new school funding process for California. In 2010, Prop 26 passed and it will be harder to raise taxes in the form of fees. In 2012, the LAO published reviews of How Property Taxes Are Used in California, How ERAF Works as well as 2012 Facts about the State. The California Budget Project published this review of Who Pay Taxes in California in 2013, Who Pay Taxes in California in 2014 and Who Pay Taxes in California in 2015. In 2014 the LAO published an explanation of the property tax collection system. In 2015, the LAO published an explanation of California Sales Tax. As the move to standards based accountability progresses, the courts and legislature are getting stuck in the middle between poor and wealthy school districts. So how do we level the playing field... in the courts or in the legislature? There are four competing models used for determining adequate school funding that give a wide ranges of costs for educating our children. In a 2005 decision, a New York court ruled the state should spend an additional $14 billion on educating New York city students. In 2007, "Getting Down to Facts (GDTF): A Research Project to Inform Solutions to California's Education Problems", was released after bipartisan group of leaders including the Governor Schwarzenegger, Senate Leader Perata, Assembly Leader Nunez and State Superintendent O'Connell requested a study of public education funding (sometimes referred to as the adequacy studies) in California. In 2010, the Public Policy Institute issued a study on School Finance Reform. In 2013,Governor Brown proposed fundamentally changing the funding of public education in California to something called Local Control Funding Formula. Comments. Questions. Broken links? Bad spelling! Incorrect Grammar? Let me know at webmaster.
|